![]() Give your company all the competitive edge it can get by analyzing what content is viewed by the competition.
Give your company all the competitive edge it can get by analyzing what content is viewed by the competition.
Assuming your competitors are large companies, who sometimes own a whole range of IP addresses with their Internet Service Provider, you can identify these companies thanks to Google Analytics.
It’s a pretty smooth ride, so follow gently along 🙂
6/12 UPDATE : New features have been added to Google Analytics V2 and now segmentation by Network Location is available! Yes!!
5/2 UPDATE : Please check my comments on the misleading nature of this segmentation. While you can segment by other metrics, the Content metric is not what it appears to be…
Let’s start by logging on to Google Analytics‘ reporting interface and select the appropriate reporting account from the drop-down list.
- Browse the left-hand side menu and look for Network Location under Marketing Optimization > Visitor Segment Performance. as shown in the graph below (click for larger view)
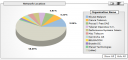
- First, you get a basic pie chart of the major entries in the report as shown below:
- Below is the extended report listing network locations as shown below.
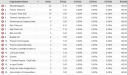
While most reports will look as though you’re only listing InternetService Providers, some items in that list will pop-up as companies or organisations. - For the sake of demonstration, let’s see what happens if we segment the entry for “Karel de Grote highschool”.
Click the red icon next to the listing entry and use successive clicks (green stars) in the pop-up menu to cross-segment traffic by content, i.e. URLs, as shown in the graph below:
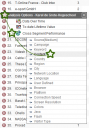
- Congratulations! You now have a view of which content was browsed by a particular organisation.
Start using this as a competitive advantage tool : chances are your competitors are looking at your flagship product’s page.


Of course this method is indicative. Cross-segmentation in Google Analytics is ubiquitous so go ahead and play around with it, see how this technique helps you get reporting on your KPIs.
NOTE: this type of cross-segmentation is available on Web Analytics tools other than Google Analytics.
If you need more information on content segmentation, KPI and report definition, contact our Web Analytics European Dream Team!

April 17, 2007 at 10:45 pm
Awesome walk-through! A very insightful article on competitive analysis using Google!
April 20, 2007 at 11:40 pm
Hi, using this for some time already (also a way of finding future competitors, scanning refs is also an good thing to do), but GA is causing problems when i perform a cross segmentation lookup on larger websites (over 50.000 uniques a day) with a date range for 2 weeks or more. Data will show up, but first i can take a shower, drink some coffee, take the dog for a walk, walk by my neighbour, do the groceries and finally return to see the results… Am I the only one, or is GA just not capable of handling big sets of data?
This cross segment by content lookup also almost always has “(no data)” as the number 1 content. Does this mean that Google drops details after a certain number of new visitors?
April 21, 2007 at 4:18 pm
Hi Ton and thanks for your feedback,
there is more than one response to your comment.
1- GA is a free tool which, for the time being, has to accomodate thousands or users. Despite the time it takes to get reports sometimes, I still think it’s one of the best tools out there in terms of price/features ratio. One trick here to avoid the wait is to download your report as Excel or CSV. That way you see the download window fill gradually and you can go do something else in the meantime 😉
So for the time being, accept Google Analytics as it is.
2- I face the very same issue and am experiencing with a workaround. I’ll keep you posted 😉
As a GAAC, I like to think that no, Google doesn’t truncate data after a given volume. I use a workaround which is really seeing the report the other way around: first, select a content report THEN segment by network location. Not the best solution I agrre but when you get a ‘no data’ report, you got to find where the data is 😉
I recommend reading the following two blogs by fellow Google Analytics experts:
– Epikone.com
– Lunametrics by Robbin Steif
Cheers,
Julien
May 2, 2007 at 11:19 am
Update: I had a chat with a GA support rep who told me this was not the intended use for this “Content”.
As it turns out, this “Content” really refers to “Ad Content”, i.e. the content of your utm_content variable, as defined in the URL.
In Google Analytics’s current state, this “Content” segmentation label is misleading and should be changed to avoid such confusion.
For now, the only alternative is to take a reverse report: get a Content by Title or Top Content report and cross individual items by Network Location.
June 13, 2007 at 7:13 pm
[…] location segmentation! Yes!! I was so disappointed when my previous post on competitive analysis was derailed by the notion of content vs Ad Content. Now you can segment your ISP by whatever field […]